Linux eBPF : Understanding Its Kernel-Level Mechanics
My first contact with eBPF was reading about a networking tool for Kubernetes called Cilium. They advertised interesting performance improvements compared to similar tools, and it was all thanks to eBPF: a technology that allows us to run small programs inside the Linux Kernel. This short description gave me a high-level view that allowed me to explore, without really understanding how it worked (which is fine).
But the time came when I wanted to know more. And I could not find a good explanation for it. Most of the articles and documentation I found, are aimed at developers using BPF to create a tool. I wanted to see the other side: how the Kernel provides this functionality.
In this article, I will give a brief overview of eBPF, what it can be used for, and go through the steps two different libraries take to load an eBPF program into the Kernel, and what the Kernel does with it. This article is for programmers trying to understand how eBPF works at a Kernel Level.
Introduction
If you are a programmer used to working in high-level applications like I am, it becomes easy to forget that for every interaction with the hardware a “program” makes, the Kernel is involved. This includes reading and writing to files, network communication, memory allocation, and even the simple “printing logs to a terminal”, among other things [1]. The Kernel has control over the programs it executes at an instruction level. While the CPU is the one responsible for executing the instructions, the Kernel is the one that decides which instructions are available for the CPU to see. It can pause and resume the execution at any time, known as time-sharing or multitasking. It is how computers can have many programs running “at the same time” with a limited number of cores [2].
The reason I am saying all this is to remind us of the responsibilities the Kernel has. It is a program that runs on the same CPU as the programs we write. When running, it has access to all the hardware resources and can do anything it wants. It runs in the so-called Kernel-mode. When our programs are running, they run in User-Space, and they access resources through the Kernel, requesting them with what is called system calls. The important takeaway is: a program makes a System Call and gets interrupted. When it happens, the Kernel code starts running to provide what was requested. Only after completed, the program can continue running. And there is always a cost to switch between the Kernel and User-Space.
We can take advantage of this. With BPF, we can hijack this flow, and run our programs in the Kernel. This can bring us a more efficient way to trace, monitor, and even control what is happening in the system, and it can also mitigate switching costs by doing it all in Kernel-Space. No context switching is required.
What is eBPF?
It is the extension of the original BPF (Berkeley Packet Filter) that was used to filter packets in the network stack. They are the same technology now, and both the BPF and eBPF names can be used interchangeably to refer to the same thing. Skipping the origin story, eBPF is a technology that allows us to run small programs inside the Linux Kernel. This could have seemed uninteresting before my introduction. But now, I bet you can imagine why this is a big deal.
These programs can be loaded at runtime without rebooting or stopping anything, and clearly, without needing to recompile (the Kernel). They are, however, limited in several ways. They are not equivalent to a Kernel module, and not as powerful (but this is a good thing). It makes them a lot simpler and safer than actual Kernel code while being able to do things not accessible to User-Space programs, or providing the efficiency of running in Kernel-Space to improve performance-critical tasks.
Like most tools, what it can do will depend only on the creativity of its users. Some of the most common use cases are:
- Tracing and monitoring: see what is being run in the Kernel or User programs;
- Security: detect or even block malicious behavior;
- Networking: monitoring and controlling network traffic.
In the following sections, we will take a brief look at what BPF is, how it works, what is provided by the Kernel, and how these interact.
How does eBPF work?
In a high-level view, BPF tools are composed of two parts: one in User-Space, and one in Kernel-Space. The User-Space part is responsible for setting up the BPF program (the Kernel-Space part), and handling communication between both parts, and if the BPF part produces any data, it must handle it. But the power comes from the ability to push all decision-making to the code running in Kernel. It avoids constantly switching to running mode and guarantees our code will be there to handle every tracked event. There can even be programs that run entirely in Kernel-Space, and the user space is only used to configure the Kernel space part.
For a given BPF tool to run, these are the basic steps that need to happen (also shown in the picture below):
- The User-Space part is started by the user;
- It compiles the BPF program to the BPF bytecode (an instruction set created for this purpose), and sends it to the Kernel;
- The program is received, and processed by the Verifier (a security mechanism that checks if the program is safe to run);
- The program is loaded into the Kernel, and attached to the desired event (defined in the program itself);
- It can now be executed by the BPF interpreter, or compiled to native code by a JIT (just-in-time compiler) to run faster;
- When the event occurs, the Kernel will execute the BPF program. It can also store information in a shared data space, that the User-Space part can read;
- If there is shared data space, the User-Space part can read from it to communicate, but it is not in sync with the Kernel events.
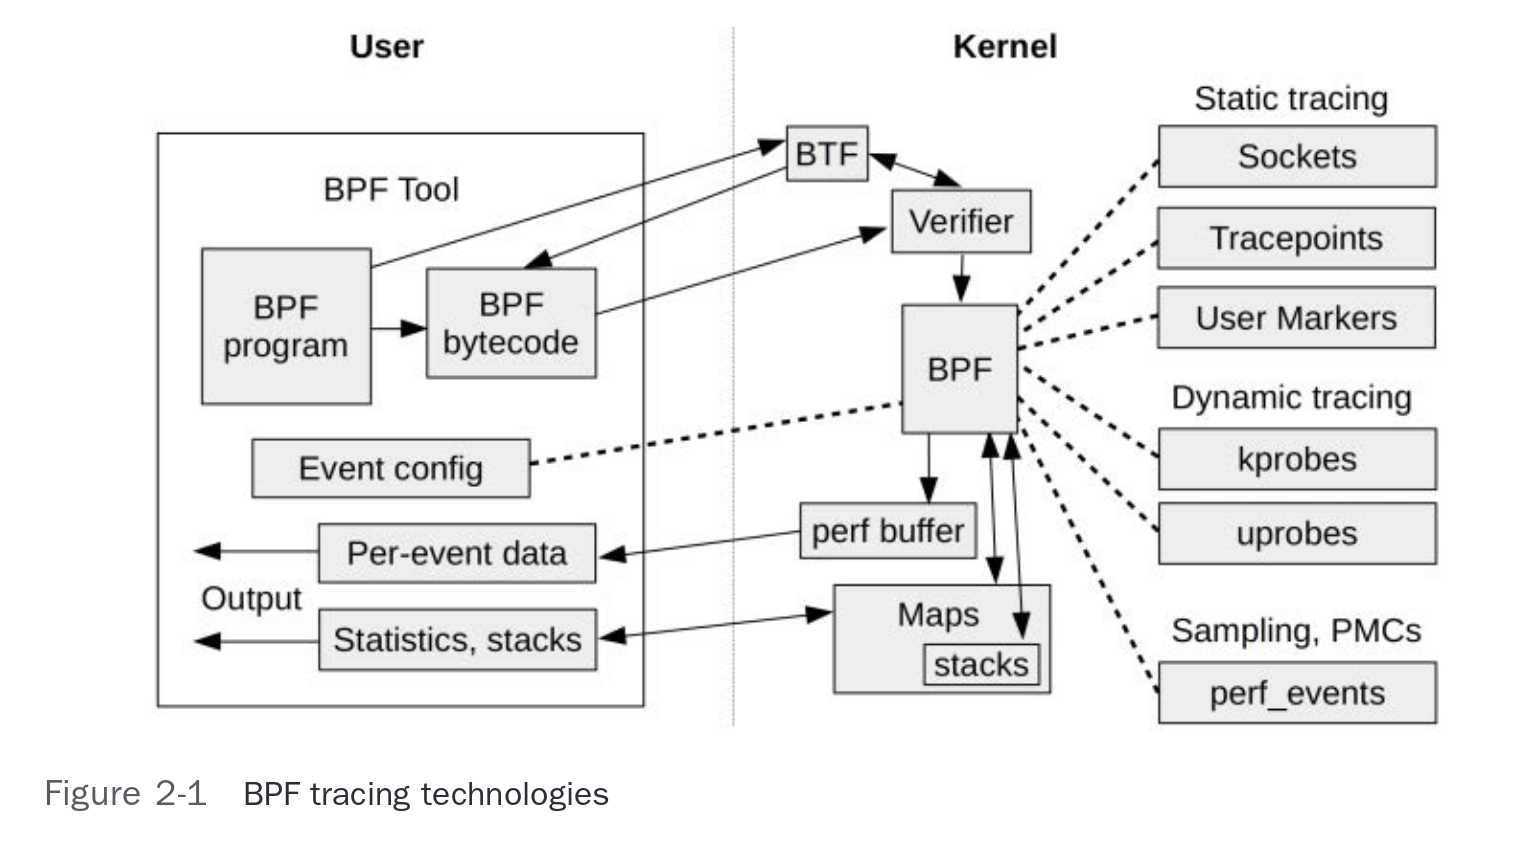 Figure 2-1 from the book “Bpf performance tools: Linux system and application observability” by Gregg Brendan [3]
I was most curious about how the Kernel attaches our program to the desired event. This felt like an alien concept to me at first. Turns out there are a couple of ways it can happen, and it is not exclusive to BPF. The Kernel had infrastructures for tracing and performance analysis that BPF can use, and there are even hardware features baked into processors.
Why use eBPF instead of existing Kernel APIs?
By now we know that BPF can be used to extend and monitor what is happening in a machine. But the Kernel already provides APIs for various use cases that might be the same. If what you need is already covered by an API, why use eBPF? As with most things, it depends. There are a few clear advantages to using eBPF, but they might not matter in some use cases.
First, BPF programs can bring the flexibility to do exactly what you want, if the API does not cover it perfectly. Second, it is event-based. If using an API-based approach, the tracing application needs to probe the API in a timely manner, fetching the results. This can lead to missing short-lived events, as they can pop in and out between each probe in the system. Using event-based tracing guarantees we will see what is being executed because the Kernel is responsible for saving the tracing information that will be read by our user-space app. [3]
Consider the following example: we want to trace every process running in a system.
The Kernel provides an API that programs like ps and top use.
The first returns a snapshot of the moment it was called, and the second updates the information at a configurable interval (3s by default).
The execsnoop BPF program I mentioned before, will trace every exec() system call, and print the information as it happens.
Since the Kernel itself reports the event, and saves it into a shared memory space, we can be sure we will see every event that happens.
What the Kernel provides
Previously I mentioned how powerful the Kernel is. I also mentioned that BPF programs are limited, and don’t have access to all the Kernel’s power. Let’s take a look at a non-exhaustive list of things that the Kernel provides to BPF programs. Some of these are available to other tools as well, but BPF can efficiently use all of them.
Tracepoints (static tracing)
Tracepoints are pre-defined points in the Kernel source code that can be used to hook a call to a function (like BPF programs) [4]. They can be turned on and off at runtime. But the Kernel always checks if the Tracepoint is enabled when executing a function that has it. So there is a (tiny) cost to them, even when not in use. But it is a reason why they can’t be implemented in all functions of the Kernel. They can be used by Kernel Modules and by BPF programs.
Dynamic Instrumentation
Dynamic Tracing methods have zero cost when not in use. There is no pre-defined code to check if some function should be called. Instead, the running software (the Kernel or a User-Space program) will be modified, replacing an address with a call to the tracing function.
All instructions executed by the CPU are stored in memory by the Kernel (including its functions) at some point. This gives it the power to change instructions at any time. It is similar to how a debugger works, where an instruction is replaced by a breakpoint instruction. But it is done in a way transparent to the applications. Software can run unmodified until tracing is needed [3]. This is also how Kernel live patching works. It replaces the first instruction of a function with a jump to the new function, and it just never returns to the original one [5].
Kprobes and Uprobes
Both Kprobes and Uprobes are methods of Dynamic Tracing. Compared to Tracepoints, there are no pre-defined points in the code to hook a trace call. Kprobes are used to trace Kernel functions. Since every interaction with the hardware goes through the Kernel, it is possible to trace almost anything every program does. We can also monitor the Kernel itself, by probing its internal functions. Uprobes are the same concept but for User-Space programs and shared libraries.
An instruction can be replaced with a call to a function to call the BPF program. When a kprobe is attached to a function start or end (kretprobe), the Kernel will save the original instruction and replace it with a breakpoint-like instruction. This instruction calls the kprobe handler, which will execute the eBPF program. After the eBPF program is executed, the original instruction is called from where it was saved, and the function is executed normally. When the probe is removed, the original instruction is restored. [3]
Perf events
Perf events is another system built into the Kernel (with a user-space tool perf to help).
It can use hardware performance counters to save measurements, and can also instrument tracepoints, kprobes, and uprobes. [6]
Perf can use the same infrastructure as BPF to attach to events, and BPF itself can use “perf_events” in some of its use cases.
The main difference is that perf needs to either work with sampling data or save all data to disk to be analyzed in user-space.
BPF can do it all in Kernel-Space.
Ftrace and FProbes
Ftrace is a tracing tool built into the Kernel that can be accessed directly (with the tracefs file system) or with the help of tools like trace-cmd.
It is designed for debugging and performance analysis, by providing a way to trace the Kernel functions being called.
Fprobe is built on top of Ftrace. It provides a way to attach callbacks to function entry and/or exit.
[7]
This is quite useful for debugging. Here is an example I used to trace the BPF syscall:
trace-cmd record -p function_graph -g __sys_bpf -F ./program
# record a function graph of the __sys_bpf function
#                                   (the BPF syscall)
#              -F: only follow calls from the "program"
trace-cmd report # or open the trace.dat file with KernelShark
Diving into the implementation
In this section, I will walk through the steps two libraries take to load an eBPF program into the Kernel: cilium-ebpf (GO) and BCC (C/Python) [8,9].
The examples I will use are: execsnoop for the BCC and the kprobe example for the cilium-ebpf library (from their repository).
They are both used to trace the exec() system call, which is used to run programs in Linux.
The first step is to write the eBPF program.
It must contain the function(s) that will be executed, and the map(s) that will be used to store data and communicate with user-space.
This is the code for the cilium’s kprobe example. It is similar to execsnoop, but simpler.
It just counts calls instead of reporting what was called:
#include "common.h" // provided by cilium-ebpf

char __license[] SEC("license") = "Dual MIT/GPL";

// the map that will be used to store the number of calls
struct bpf_map_def SEC("maps") kprobe_map = {
  .type        = BPF_MAP_TYPE_ARRAY,
  .key_size    = sizeof(u32),
  .value_size  = sizeof(u64),
  .max_entries = 1,
};

// the event that will be traced
SEC("kprobe/sys_execve")
// the function that will be executed when the event happens
int kprobe_execve() {
  // this key value will be used as a reference in the user-space
  // program to read the value stored in the map.
  u32 key     = 0;
  u64 initval = 1, *value_pointer;

  value_pointer = bpf_map_lookup_elem(&kprobe_map, &key);
  if (!value_pointer) {
    bpf_map_update_elem(&kprobe_map, &key, &initval, BPF_ANY);
    return 0;
  }
  // a simple increment to the value stored in the map
  __sync_fetch_and_add(value_pointer, 1);
  return 0;
}
With the program written, we need to compile it. The steps both libraries will take are roughly equivalent to:
- Compile the BPF program
- Load the BPF program into the Kernel
- Load the interfaces to interact with the program (like the map in this example)
- Attach the program to the desired event
This program has to be compiled into BPF Bytecode. Both tools use the Clang (LLVM) compiler but in different ways.
Python and BCC
The Python BPF Compiler Collection (BCC) [10] implementation takes the program either as a string or a file and compiles it right before loading it into the Kernel. It needs to be compiled every time the tool is run (unlike the GO library in the next section). Because of this, it is expected to have all these dependencies to run a tool built with BCC: Python, BCC, Clang/llvm & Linux Headers.
Note: The code snippets below are a simplified version of the calls made by the BCC library.
For the user writing the BPF tool, this is as simple as running the following Python code.
from bcc import BPF

# where bpf_text is a program similar written in the BPF C-like language
b = BPF(text=bpf_text)
# OR, point to a file
b = BPF(src_file=bpf_file)
This BPF Python Class takes the program as input and loads it into memory. It will parse it, detect features in use, and even modify it by adding default headers.
# bcc/src/__init__.py - BPF class

def __init__(self, src_file=b"", hdr_file=b"", text=None, debug=0,
            cflags=[], usdt_contexts=[], allow_rlimit=True, device=None,
            attach_usdt_ignore_pid=False):
...
self.module = lib.bpf_module_create_c_from_string(text,
                                                  self.debug,
                                                  cflags_array, len(cflags_array),
                                                  allow_rlimit, device)
The bpf_module_create_c_from_string function is a call to its C++ function implementation with the same name.
It uses Clang as a library to compile the BPF program into BPF bytecode.
// bcc/src/cc/bpf_module.cc

BPFModule::BPFModule(unsigned flags, TableStorage *ts, bool rw_engine_enabled,
                     const std::string &maps_ns, bool allow_rlimit,
                     const char *dev_name)
...

// load an entire c file as a module
int BPFModule::load_cfile(const string &file, bool in_memory, const char *cflags[], int ncflags) {
  ClangLoader clang_loader(&*ctx_, flags_);
  if (clang_loader.parse(...))
    return -1;
  return 0;
}
Once compiled, the BPF program (now in bytecode) can be loaded into the Kernel. I will not go too deep here, because it is mostly the same as the next section.
int bpf_btf_load(const void *btf_data, size_t btf_size, const struct bpf_btf_load_opts *opts)
  union bpf_attr attr;
  // fd is a file descriptor to the BPF program (like a file ID)
  // it is a way for the user-space and Kernel to reference the program when it is loaded
  int fd;
  ...
  // links the BPF bytecode to the attr structure
  attr.btf = ptr_to_u64(btf_data);

  // this is a SYSCALL. In other words, the User-Space calls a Kernel API.
  fd = sys_bpf_fd(BPF_BTF_LOAD, &attr, attr_sz);
}
Back to the Python code, the next step is to attach the program to the desired event.
The functions attach_kprobe and attach_kretprobe both instrument the Kernel function execve_fnname.
They attach the function with the name passed to fn_name to the start and end of execve_fnname respectively.
The fn_name function names need to match the ones in the BPF program loaded earlier.
# returns the corresponding Kernel function name of the syscall
# (for the specific architecture/version running)
execve_fnname = b.get_syscall_fnname("execve")

# These functions are also SYSCALLS, witch will reference the file descriptor of the BPF program
b.attach_kprobe(event=execve_fnname, fn_name="syscall__execve")
b.attach_kretprobe(event=execve_fnname, fn_name="do_ret_sys_execve")
At this point, the user space part of this tool is ready to collect the data recorded and report to the user.
GO and cilium-ebpf
The Cilium eBPF library [8], takes an approach with code generation to reduce manual work and achieve a high-performance implementation. The Cilium project uses eBPF to handle container networking in Kubernetes (aiming to be more performant than user-space tools). For this, having a performant and less bug-prone way to interact with the Kernel is crucial.
Their implementation generates an API for each BPF program, covering only the capabilities compatible with it.
In the Python implementation, the user had to manually call attach_kprobe and attach_kretprobe after loading the program, referencing the function names to be loaded.
This is however directly coupled to the BPF program we provided and can be error-prone. What if the function name changes? What if it is no longer using a kprobe?
The cilium-ebpf library creates a GO API that abstracts these details and makes it easier to use the BPF program.
The process behind it is quite interesting. These are the stages to it:
- Writing the BPF program (with the same C-like syntax),
- The bpf2go tool is used to generate GO “glue” code,
- The BPF program is compiled (using Clang under the hood),
- GO compilation (our code + generated code), and the compiled BPF program gets embedded into the GO binary.
For the first two steps, assuming the BPF program is in a local file called kprobe.c, the bpf2go tool must be invoked.
It can be done directly or with a go:generate directive that can be added to a Go file (like the next code block).
With this in our current directory, the go generate command can be issued.
package main

//go:generate go run github.com/cilium/ebpf/cmd/bpf2go bpf kprobe.c -- -I../path_to_headers
The bpf2go program will automatically detect from our BPF program, what functions it uses to interact with the Kernel, and also the data structures it uses to communicate back to user-space.
It will compile our BPF program with Clang, generate the GO code that will load it into the Kernel, and Access the data it produces.
One part of this glue code uses a go:embed directive.
It instructs the compiler to include the data from the binary generated in step 2 into a variable in the GO binary (step 4):
//go:embed bpf_bpfel.o
var _BpfBytes []byte
Now, I will show the GO code called by the “glue” code on our behalf.
Note: The code snippets below are a simplified version of the calls made by the cilium-ebpf library. The actual implementation is in github.com/cilium/ebpf/link/kprobe.go.
When we compile everything, the resulting binary will contain the BPF program, the GO code to load it into the Kernel, and the code to interact with it. This means once you have the resulting binary, it can run on any Linux machine with a compatible Kernel. Some other things need to happen that I won’t cover:
- the library needs to also load the structures that will be used to interact with the program, like the map used in this example. I will only show the user space part of this operation.
- the library might need to check if the addresses we got when compiling the BPF program are valid in the Kernel we are running on. If they are different, it can map them. This is referred to as CO-RE (compile once, run everywhere).
The first important section is the initial load of the BPF program into the Kernel.
It is done with the SYS_BPF syscall, using the BPF_BTF_LOAD command, and a set of parameters in a structure.
It is after this call that the Kernel runs the Verifier, to check if the program is safe to run.
If it is, the program is loaded into memory, and we get a file descriptor that points to it.
attr := &sys.ProgLoadAttr{
    // bytecode: the compiled instructions for the function
    Insns :             sys.NewSlicePointer(bytecode),
    ProgType:           sys.ProgType(spec.Type),
    ProgFlags:          spec.Flags,
    ExpectedAttachType: sys.AttachType(spec.AttachType),
    License:            sys.NewStringPointer(spec.License),
    KernVersion:        kv,
}

// code from: ProgLoad
programRawFD, _, errNo := unix.Syscall(unix.SYS_BPF, uintptr(BPF_BTF_LOAD), unsafe.Pointer(attr), unsafe.Sizeof(*attr))
return NewFD(int(fd))
Now that we have the program loaded into the Kernel, we need to attach it to the desired event. The library will first check if the desired event is available in the Kernel.
// code from : kprobe, pmuProbe

// Create a pointer to a NUL-terminated string for the Kernel.
// this is the name of the (Kernel) function we want to trace.
sp, err = unsafeStringPtr("sys_execve") // or ach specific, like "__x64_sys_execve"
attr = unix.PerfEventAttr{
      Type:   uint32(KPROBE),      // PMU event type read from sysfs
      Ext1:   uint64(uintptr(sp)), // Kernel symbol to trace
      Ext2:   args.Offset,         // Kernel symbol offset
            ...
    }

rawFd, _, e1 := unix.Syscall(unix.SYS_BPF, SYS_PERF_EVENT_OPEN, uintptr(unsafe.Pointer(attr)), uintptr(pid), uintptr(cpu), uintptr(groupFd), uintptr(flags), 0)
// rawFd is the file descriptor of the perf event
// ... check error e1

// this is the file descriptor of the perf event we want to trace
kprobeFd, err := sys.NewFD(int(rawFd))
If this is successful, we know we can ask the Kernel to add a probe there.
This is done with the SYS_BPF syscall, with the BPF_LINK_CREATE command.
// code from: attachPerfEventLink

rawFd2, _, errNo := unix.Syscall(unix.SYS_BPF, uintptr(BPF_LINK_CREATE), uintptr(attr), size)
// ... check error errNo

ebpfProgramLinkFd, err := sys.NewFD(int(rawFd2))
At a high-level, these are the steps to load a BPF program into the Kernel. If the user-space part needs to read data produced by the BPF program (this example does), we need to lookup the map defined previously. A Map can store a lot of data, and it’s flexible. One of the ways to navigate it is to read “keys” by an index (like an array) and get the value stored in the map. This example has a single value stored in the map, and the key is defined in the BPF code at the start of this exploration. This is how it is done in the cilium-ebpf library:
// this first block is part of the program we write on top of the cilium-ebpf library
// and the subsequent functions are part of the library itself
for range ticker.C { // every second
  var value uint64
  // passes a pointer to the "value" variable
  // it will retrieve the value and unmarshal it into the pointer
  // it will call a syscall to read the "mapKey" (0 in this case)
  if err := objs.KprobeMap.Lookup(mapKey, &value); err != nil {
    log.Fatalf("reading map: %v", err)
  }
  log.Printf("%s called %d times
", fn, value)
}

// calls -->
func (m *Map) Lookup(key, valueOut interface{}) error
// calls ->
func (m *Map) LookupWithFlags(key, valueOut interface{}, flags MapLookupFlags) error {
  // in case the program runs on every CPU
  if m.typ.hasPerCPUValue() {
      // this does the same as below, but for each CPU
    return m.lookupPerCPU(key, valueOut, flags)
  }
  // created a buffer to store a copy of the bytes from the Kernel map.
  valueBytes := makeMapSyscallOutput(valueOut, m.fullValueSize)
  // this call is expanded below
  if err := m.lookup(key, valueBytes.Pointer(), flags); err != nil {
    return err
  }

  // this will check the type "valueOut", and unmarshal the bytes into it
  return m.unmarshalValue(valueOut, valueBytes)
}

// calls -->

func (m *Map) lookup(key interface{}, valueOut sys.Pointer, flags MapLookupFlags) error {
  keyPtr, err := m.marshalKey(key)
  if err != nil {
    return fmt.Errorf("can't marshal key: %w", err)
  }
  // input to the syscall
  attr := sys.MapLookupElemAttr{
    MapFd: m.fd.Uint(),
    Key:   keyPtr,
    // with a pointer to where we want to store the value
    Value: valueOut,
    Flags: uint64(flags),
  }
  // the actual syscall
  err := unix.Syscall(unix.SYS_BPF, BPF_MAP_LOOKUP_ELEM, unsafe.Pointer(attr), unsafe.Sizeof(*attr))
  if err != nil {
    return fmt.Errorf("lookup: %w", wrapMapError(err))
  }
  return nil
}
With this done, the user-space part can handle the data produced by the BPF program. In this case, it just logs it every second.
What happens in the Kernel
In the Go example, I showed the SYS_BPF Syscall being used two times.
Each one, with a different command: BPF_PROG_LOAD and BPF_LINK_CREATE.
This Syscall SYS_BPF selects what it should do based on a command passed as input.
It expects the command and a pointer to a structure that contains the attributes needed to execute the command.
There is one interesting check made before the command is executed. Since a program compiled with a newer version of the Kernel can be sent to run in an older version, the Kernel sets to Zero all extra memory space it does not know about. This guarantees the program will not depend on features not available in the Kernel it is running on.
Note: This section has a lot of code from the Kernel, and a big part of the explanation is in the comments I added to the code. My comments will be always noted by
//. There are also some comments from the original code that I left in (when useful), and they start with/*.
static int __sys_bpf(int cmd, bpfptr_t uattr, unsigned int size)
{
  union bpf_attr attr;
  err = bpf_check_uarg_tail_zero(uattr, sizeof(attr), size);
  ... // other checks
  /* copy attributes from user space, may be less than sizeof(bpf_attr) */
  memset(&attr, 0, sizeof(attr));
  if (copy_from_bpfptr(&attr, uattr, size) != 0)
    return -EFAULT;
  ...
  switch (cmd) {
  case BPF_MAP_CREATE:
    err = map_create(&attr);
    break;
    ...
  case BPF_PROG_LOAD:
    err = bpf_prog_load(&attr, uattr, size);
    break;
    ...
  case BPF_LINK_CREATE:
    err = link_create(&attr, uattr);
    break;
    ...
    default:
    err = -EINVAL;
    break;
}
Loading Program
In the BPF_PROG_LOAD command function, the Kernel will load to program into memory for each CPU, check if it is safe to run, add it to the Kernel’s symbol table,
and create a file descriptor for the program.
I found it quite interesting that the Kernel code expects the program to provide its license, and checks if it is compatible with the GPL (used by the Kernel).
static int bpf_prog_load(union bpf_attr *attr, bpfptr_t uattr, u32 uattr_size)
{
  enum bpf_prog_type type = attr->prog_type;
  struct bpf_prog *prog, *dst_prog = NULL;
  struct btf *attach_btf = NULL;
  int err;
  char license[128];
  ... // permission checks, validations
  if (attr->attach_prog_fd) {
    // reads the program from the file descriptor
    dst_prog = bpf_prog_get(attr->attach_prog_fd);
    ...
  }
  // allocates memory for the program for each CPU (core)
  prog = bpf_prog_alloc(bpf_prog_size(attr->insn_cnt), GFP_USER);
  if (!prog) { ... // error handling
  ... // copies the relevant data from attr struct to the new prog structure
  /* copy eBPF program license from user space */
    if (strncpy_from_bpfptr(license,
          make_bpfptr(attr->license, uattr.is_Kernel),
          sizeof(license) - 1) < 0)
      goto free_prog_sec;

  /* eBPF programs must be GPL compatible to use GPL-ed functions */
  prog->gpl_compatible = license_is_gpl_compatible(license) ? 1 : 0;
  ...
  /* run eBPF verifier */
  // this is a security check to make sure the program is safe to run
  // is is important but complex. I will not cover it here
  err = bpf_check(&prog, attr, uattr, uattr_size);
  if (err < 0)
    goto free_used_maps;
  ...
  err = bpf_prog_alloc_id(prog);
  if (err)
    goto free_used_maps;

  /* Upon success of bpf_prog_alloc_id(), the BPF prog is
    * effectively publicly exposed. However, retrieving via
    * bpf_prog_get_fd_by_id() will take another reference,
    * therefore it cannot be gone underneath us.
    *
    * Only for the time /after/ successful bpf_prog_new_fd()
    * and before returning to userspace, we might just hold
    * one reference and any parallel close on that fd could
    * rip everything out. Hence, below notifications must
    * happen before bpf_prog_new_fd().
    *
    * Also, any failure handling from this point onwards must
    * be using bpf_prog_put() given the program is exposed.
    */
  // bpf_prog_kallsyms_add creates an entry in the Kernel's symbol table
  // available under /proc/kallsyms
  // it contains the memory address, the type of the symbol, and its name
  bpf_prog_kallsyms_add(prog);
  ...
  // creates the file descriptor for the program
  err = bpf_prog_new_fd(prog);
  if (err < 0)
    bpf_prog_put(prog);
  return err;
  ... // error handling for the previous goto statements
}
Now let’s take a look at the BPF_LINK_CREATE command.
This is the one that will attach the program to the desired event.
Its behavior changes for each type of program being attached.
I will focus show the parts relevant to the kprobe example.
static int link_create(union bpf_attr *attr, bpfptr_t uattr)
{
  struct bpf_prog *prog;
  ...
  prog = bpf_prog_get(attr->link_create.prog_fd);
  ...
  // validates the attach type of the program
  // mostly to cache options improperly combined
  ret = bpf_prog_attach_check_attach_type(prog,
            attr->link_create.attach_type);
  ...
  // There is not much happening in this block, just a big switch statement
  switch (prog->type) {
  ...
  case BPF_PROG_TYPE_TRACING:
    if (attr->link_create.attach_type != prog->expected_attach_type) {
      ret = -EINVAL;
      goto out;
    }
    if (prog->expected_attach_type == BPF_TRACE_RAW_TP)
      ret = bpf_raw_tp_link_attach(prog, NULL);
    else if (prog->expected_attach_type == BPF_TRACE_ITER)
      ret = bpf_iter_link_attach(attr, uattr, prog);
    else if (prog->expected_attach_type == BPF_LSM_CGROUP)
      ret = cgroup_bpf_link_attach(attr, prog);
    else
      ret = bpf_tracing_prog_attach(prog,
                  attr->link_create.target_fd,
                  attr->link_create.target_btf_id,
                  attr->link_create.tracing.cookie);
    break;
  ...
  case BPF_PROG_TYPE_PERF_EVENT:
  case BPF_PROG_TYPE_TRACEPOINT:
    ret = bpf_perf_link_attach(attr, prog);
    break;
  case BPF_PROG_TYPE_KPROBE:
    if (attr->link_create.attach_type == BPF_PERF_EVENT)
      ret = bpf_perf_link_attach(attr, prog);  // OUR CASE
    else if (attr->link_create.attach_type == BPF_TRACE_KPROBE_MULTI)
      ret = bpf_kprobe_multi_link_attach(attr, prog); // also interesting
    else if (attr->link_create.attach_type == BPF_TRACE_UPROBE_MULTI)
  ...
  }
I will expand two branches: bpf_perf_link_attach and bpf_kprobe_multi_link_attach int the subsections below:
Events with Perf
At this point, the Kernel will choose the infrastructure to attach the program with.
Some available here are tracepoints, perf events, and fprobe.
Our case is the BPF_PERF_EVENT attach type, which will use the perf infrastructure.
static int bpf_perf_link_attach(const union bpf_attr *attr, struct bpf_prog *prog)
{
  struct bpf_link_primer link_primer;
  struct bpf_perf_link *link;
  struct perf_event *event;
  struct file *perf_file;
  int err;

  if (attr->link_create.flags)
    return -EINVAL;
  // gets the file descriptor of the perf event we want to trace
  // it must have been added to target_fd in the user space part
  perf_file = perf_event_get(attr->link_create.target_fd);
  if (IS_ERR(perf_file))
    return PTR_ERR(perf_file);
  ... // link allocation omitted
  bpf_link_init(&link->link, BPF_LINK_TYPE_PERF_EVENT, &bpf_perf_link_lops, prog);
  link->perf_file = perf_file;

  // this is a important step. It prepares the bpf_link to be exposed to user space.
  // in short, it creates the inode that will be linked to a file descriptor when the bpf_link_settle is called.
  err = bpf_link_prime(&link->link, &link_primer);
  if (err) {
    kfree(link);
    goto out_put_file;
  }

  event = perf_file->private_data;
  // this call will attach the BPF program to the perf event (details next)
  err = perf_event_set_bpf_prog(event, prog, attr->link_create.perf_event.bpf_cookie);
  if (err) {
    ...
  }
  /* perf_event_set_bpf_prog() doesn't take its own refcnt on prog */
  bpf_prog_inc(prog);
  // exposes the inode created in bpf_link_prime to user space as a file descriptor
  return bpf_link_settle(&link_primer);
  ...
}
In this next block, I explore the calls following perf_event_set_bpf_prog from the block above.
It will register the BPF program to the event using the perf infrastructure.
For a given event, the Kernel creates a list of programs to be executed.
When the event occurs, the Kernel will execute all the programs in the list.
int perf_event_set_bpf_prog(struct perf_event *event, struct bpf_prog *prog,
          u64 bpf_cookie)
{
  ... // lots of checks omitted here
  return perf_event_attach_bpf_prog(event, prog, bpf_cookie);
}
// Calls next -->

// global definition of this mutex
static DEFINE_MUTEX(bpf_event_mutex);
// constant defines the maximum number of tracers that can be attached to an event
#define BPF_TRACE_MAX_PROGS 64

int perf_event_attach_bpf_prog(struct perf_event *event,
            struct bpf_prog *prog,
            u64 bpf_cookie)
{
  struct bpf_prog_array *old_array;
  struct bpf_prog_array *new_array;
  int ret = -EEXIST;

  /*
  * Kprobe override only works if they are on the function entry,
  * and only if they are on the opt-in list.
  */
  if (prog->kprobe_override &&
      (!trace_kprobe_on_func_entry(event->tp_event) ||
      !trace_kprobe_error_injectable(event->tp_event)))
    return -EINVAL;

  // this mutex is global, and it protects the code below from
  // running in parallel in another CPU
  mutex_lock(&bpf_event_mutex);
  ...
  // reads the existing array of programs attached to the event
  old_array = bpf_event_rcu_dereference(event->tp_event->prog_array);
  if (old_array &&
      bpf_prog_array_length(old_array) >= BPF_TRACE_MAX_PROGS) {
      // return an error if the maximum number of programs was reached already
    ret = -E2BIG;
    goto unlock;
  }
  // copies the old array to the new one, adding the new program
  ret = bpf_prog_array_copy(old_array, NULL, prog, bpf_cookie, &new_array);
  if (ret < 0)
    goto unlock;

  /* set the new array to event->tp_event and set event->prog */
  event->prog = prog;
  event->bpf_cookie = bpf_cookie;
  // replaces the old array with the new one
  rcu_assign_pointer(event->tp_event->prog_array, new_array);
  // clears the old array
  bpf_prog_array_free_sleepable(old_array);

unlock:
  mutex_unlock(&bpf_event_mutex);
  return ret;
}
Events with FProbe
This next section involves possibly finding the addresses of the symbols (function names) we want to trace. The Kernel must look at its own symbol table (in the compiled binary) to find them.
int bpf_kprobe_multi_link_attach(const union bpf_attr *attr, struct bpf_prog *prog)
{
  struct bpf_kprobe_multi_link *link = NULL;
  struct bpf_link_primer link_primer; // will store the bpf_link and file descriptor
  void __user *ucookies;
  unsigned long *addrs;
  u32 flags, cnt, size;
  void __user *uaddrs;
  u64 *cookies = NULL;
  void __user *usyms;
  int err;
  ...
  // if the bpf program passed in the addresses it want to trace, the Kernel copies them here
  // Otherwise, if it passed a symbol list, the else branch looks for the addresses
  // either branch will have an address list in the addrs variable if successful
  if (uaddrs) {
    if (copy_from_user(addrs, uaddrs, size)) {
     ...
    }
  } else {
    ...
    struct user_syms us;
    // copy symbols from user space to Kernel space
    err = copy_user_syms(&us, usyms, cnt);
    ...
    sort_r(us.syms, cnt, sizeof(*us.syms), symbols_cmp_r,
            symbols_swap_r, &data);

    err = ftrace_lookup_symbols(us.syms, cnt, addrs);
    // This function will find the addresses of all symbols in the list
    // it looks at vmlinux, and if not all symbols were found, it also looks at all loaded modules
    // it expects the symbol list to be sorted alphabetically for efficiency.
    // (If it finds a symbol, not need to restart the loop from the beginning for the next one)
    ...
  }
  ... // link creation, same as the perf event
  err = bpf_link_prime(&link->link, &link_primer);
  ...
  // the next block adds a reference to the wrapper function that will call the BPF program
  // the explanation for this is right after this code block.
  if (flags & BPF_F_KPROBE_MULTI_RETURN)
    // to be called after the function returns
    link->fp.exit_handler = kprobe_multi_link_exit_handler;
  else
    // to be called before the function is executed
    link->fp.entry_handler = kprobe_multi_link_handler;
 link->addrs = addrs;
  ...
  err = get_modules_for_addrs(&link->mods, addrs, cnt);
  if (err < 0) {
    bpf_link_cleanup(&link_primer);
    return err;
  }
  link->mods_cnt = err;
  // this adds yet another wrapper function that does some safety checks,
  // disables preemption and executes the next operation: the program wrapped and
  // registered to exit_handler or entry_handler above
  err = register_fprobe_ips(&link->fp, addrs, cnt);
  // exposes the inode created in bpf_link_prime to user space as a file descriptor
 return bpf_link_settle(&link_primer);
  ...
}
In the last lines of the previous block, we registered the link->fprobe to be called by the fprobe/ftrace infrastructure.
The wrappers kprobe_multi_link_handler and kprobe_multi_link_exit_handler will handle the reference from fp back to the link structure using the container_of macro.
This macro is used everywhere in the Kernel, and it’s worth explaining it here.
It gets the parent struct by subtracting from the known pointer the offset of memory required to store all fields that came before it in the parent struct [10].
This is analogous to a super() function in Python and other OO languages.
This next block shows the BPF program being linked as a function handler with Fprobe. I will also follow a chain of function calls that will lead to the BPF program being executed.
static void
kprobe_multi_link_exit_handler(struct fprobe *fp, unsigned long fentry_ip,
              unsigned long ret_ip, struct pt_regs *regs,
              void *data)
{
  struct bpf_kprobe_multi_link *link;

  link = container_of(fp, struct bpf_kprobe_multi_link, fp);
  kprobe_multi_link_prog_run(link, get_entry_ip(fentry_ip), regs);
}


int register_fprobe_ips(struct fprobe *fp, unsigned long *addrs, int num)
{
  int ret;

  if (!fp || !addrs || num <= 0)
    return -EINVAL;

  fprobe_init(fp); // This will call the chain described below

  ret = ftrace_set_filter_ips(&fp->ops, addrs, num, 0, 0);
  if (ret)
    return ret;

  ret = fprobe_init_rethook(fp, num);
  if (!ret)
    ret = register_ftrace_function(&fp->ops);

  if (ret)
    fprobe_fail_cleanup(fp);
  return ret;
}

static void fprobe_init(struct fprobe *fp)
{
  ...
  if (fprobe_shared_with_kprobes(fp))
    fp->ops.func = fprobe_kprobe_handler;
  ...
}

// registers in ops.func the following function

static void fprobe_kprobe_handler(unsigned long ip, unsigned long parent_ip,
      struct ftrace_ops *ops, struct ftrace_regs *fregs)
{
  struct fprobe *fp;
  int bit;

  fp = container_of(ops, struct fprobe, ops);
  if (fprobe_disabled(fp))
    return;

  /* recursion detection has to go before any traceable function and
    * all functions called before this point should be marked as notrace
    */
  bit = ftrace_test_recursion_trylock(ip, parent_ip);
  if (bit < 0) {
    fp->nmissed++;
    return;
  }

  /*
    * This user handler is shared with other kprobes and is not expected to be
    * called recursively. So if any other kprobe handler is running, this will
    * exit as kprobe does. See the section 'Share the callbacks with kprobes'
    * in Documentation/trace/fprobe.rst for more information.
    */
  if (unlikely(kprobe_running())) {
    fp->nmissed++;
    goto recursion_unlock;
  }

  kprobe_busy_begin();
  __fprobe_handler(ip, parent_ip, ops, fregs);
  kprobe_busy_end();

recursion_unlock:
 ftrace_test_recursion_unlock(bit);
}

// CALLS -->

static void fprobe_handler(unsigned long ip, unsigned long parent_ip,
  struct ftrace_ops *ops, struct ftrace_regs *fregs)
{
  struct fprobe *fp;
  int bit;

  fp = container_of(ops, struct fprobe, ops);
  if (fprobe_disabled(fp))
    return;

  /* recursion detection has to go before any traceable function and
   * all functions before this point should be marked as notrace
   */
  bit = ftrace_test_recursion_trylock(ip, parent_ip);
  if (bit < 0) {
    fp->nmissed++;
    return;
  }
  __fprobe_handler(ip, parent_ip, ops, fregs);
  ftrace_test_recursion_unlock(bit);
}

// CALLS -->

static inline void __fprobe_handler(unsigned long ip, unsigned long parent_ip,
      struct ftrace_ops *ops, struct ftrace_regs *fregs)
{
  ...
  struct fprobe *fp;

  fp = container_of(ops, struct fprobe, ops);
  // this handler checks what handlers were attached (entry or exit) and runs them
  if (fp->exit_handler) {
  ... // skipping this because the next case is simpler to understand
  // looking at the entry
  if (fp->entry_handler)
    ret = fp->entry_handler(fp, ip, parent_ip, ftrace_get_regs(fregs), entry_data);
  ...
}
Conclusion
This article explored the mechanics of Linux eBPF, starting from user-space libraries and diving into the Kernel-level operations. By digging into the APIs and the kernel’s role, we’ve gained a deeper understanding of how eBPF functions and its potential applications. For me, one great discovery was how much the BPF interacts with other subsystems to provide its power.
For those curious about eBPF, this journey should hopefully provide some guidance. However, our exploration only scratches the surface. The technologies that were used here to complement BPF should be a good next challenge do uncover. The Linux kernel is a vast and complex project, and BPF itself continues to evolve with new capabilities and applications.
I hope this article has inspired you to delve deeper into the Linux Kernel. Thank you for joining me! Happy exploring!
References
- [1] A. S. Tanenbaum and H. J. Bos, Modern Operating Systems, 4th Edition. Pearson Higher Education, 2015.
- [2] D. M. Ritchie and K. Thompson, “The UNIX time-sharing system,” Communications of the ACM, vol. 17, no. 7, pp. 365–375, Jul. 1974
- [3] B. Gregg, Bpf performance tools: Linux system and application observability, 1st ed. Hoboken: Pearson Education, Inc, 2019.
- [4] “Tracepoints Documentation — The Linux Kernel documentation,” Kernel.org. docs.Kernel.org/trace/tracepoints.html.
- [5] S. Rostedt, “Learning the Linux Kernel with tracing”, Oct 31, 2018 youtube.com/watch?v=JRyrhsx-L5Y
- [6] “Perf Wiki,” perf.wiki.Kernel.org. perf.wiki.Kernel.org/
- [7] “Fprobe - Function entry/exit probe — The Linux Kernel documentation,” Kernel.org. Kernel.org/doc/html/latest/trace/fprobe.html
- [8] “cilium/ebpf,” GitHub, github.com/cilium/ebpf
- [9] “iovisor/bcc,” GitHub, github.com/iovisor/bcc
- [10] G. Kroah-Hartman, “container_of()” kroah.com, Feb. 18, 2005. kroah.com/log/linux/container_of.html
- [11] “BPF Documentation — The Linux Kernel documentation,” Kernel.org. Kernel.org/doc/html/latest/bpf/index.html.
Appendix
What was my process to get here
- I knew a bit about the BPF tech, but only from the “user” side. I went a bit deeper into this, reading a book and watching talks on the topic
- I ran the examples for some BPF tools, and chose two to dive into
- When I got to the Kernel code, I had to read a lot of it to understand what was happening
- I tried using trace-cmd to watch the execution of a BPF program, but it was not satisfactory
- I used the Kernel’s
printk(KERN_INFO ...);to track the execution of the BPF program in the Kernel, watching the outputs withdmseg -w(with the VM I created in my last post.) - Compiled the Kernel with warning levels 1, 2, and 3 to see what kind of warnings are there in this subsystem. I also used this to make small contributions.
Testing inside a VM
I compiled my versions of the Linux Kernel to explore, adding print statements to the Kernel code. To test it, I ran it all in a VM, with the setup described in my last post.
To run bpftool, and BCC in the Debian VM, I had to install some dependencies:
apt update
apt install make gcc clang bcc bpftool glibc-source libelf-dev linux-headers-amd64 build-essential

## If you see an error with the libc version
echo "deb https://deb.debian.org/debian experimental main" >> /etc/apt/sources.list
apt install -t experimental libc-bin
Useful tool: bpftrace
Bpftrace is a high-level tracing tool for Linux BPF. It uses a simple language to install simple probes in the Kernel. One useful feature is listing all tracepoints available in the Kernel:
bpftrace -l 'tracepoint:*'There are some one-liner examples, and other more complex scripts that can be run with bpftrace. Check more in their repository github.com/bpftrace/bpftrace.